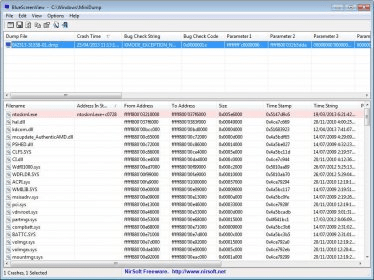
BlueScreenView allows you to recover the information generated during a system crash to analyze it in detail. It displays a very complete set of information about a specific crash event, like the exact date and time, the libraries and modules involved and the stack status at the moment of the crash. You can change the MiniDump folder location and analyze other concurrent Windows installations, too.
The program's user interface has a really basic and too-classical design, and leaves a lot to be desired, visually speaking. It basically consists of an upper panel, where the found crash events are listed, and a lower panel, which shows detailed information about the selected event. The program allows you to select a “lower panel mode”, and configure what will be shown there. The available modes are – all drivers, drivers found in stack only, blue screen in XP style (a replica of the BSOD as it appeared on your screen), DumpChk output, and raw data.
Besides that, in the "Advanced Options" window you can set the folder from where you wish to load the crash information, load the crash information from several remote computers whose network names are listed in a text file, load a single MiniDump file, and also modify the DumpChk command line string. All of this is possible since Windows saves the information about crash events inside a folder named “MiniDump”, normally located inside the “Windows” folder. This way, you can select the MiniDump folders either of a remote computer or of a parallel Windows installation on the same PC.
Finally, the program provides you with even more functions, such as saving the selected items into a text file and displaying a very complete set of information about the selected item.

It is a neat application that helps you keep you computer clean and optimized.

If you keep getting system errors, might as well pretend you control them.


Comments